
Music Preferences as Predictors of Online Messaging Activity
Abstract
This study aimed to investigate how one’s habits across music streaming and online messaging may be related. To do so, the researcher analyzed public messages from 2,426 Discord users, also retrieving Spotify playlist data from those who had an account linked on their profiles. Pearson correlation tests demonstrated various weak yet statistically significant linear relationships between variables across the categories of Discord message and Spotify playlist data. Most of the relationships involved correlations between parts of speech or message complexity in Discord messages and various Spotify metrics. Some of these relationships may be explained by confounding variables such as personality traits, although further research is required to confirm this hypothesis. The findings may be applicable to improving music recommendation algorithms or in fields such as marketing and social research.
Keywords: music streaming, online messaging, Discord, Spotify, linguistic analysis, message complexity, parts of speech, playlist characteristics, Pearson correlation, behavioral patterns, personality traits, recommendation systems, social media analytics, digital behavior
Introduction
There are many popular stereotypes about the way that one behaves and interacts with others according to the music they listen to. Since music streaming and online messaging are two omnipresent activities in the modern world, such stereotypes would undoubtedly manifest as correlations between both activities, assuming there is any validity in them. This information would also be useful for applications in areas such as marketing, social research, and recommendation algorithms.
There is a notable lack of existing research that attempts to identify such correlations. While much previous literature has investigated the factors that influence music preference and online communication separately, very few studies, if any, have investigated the relationships and patterns between both activities.
This study aims to determine to what extent variables in music preference and online messaging activity can act as predictors of other cross-category variables by analyzing user data from Spotify, a music streaming platform, and Discord, a social and messaging platform.
Literature Review
There is no significant research investigating the relationship between one’s music streaming and online messaging activity, which leaves a gap for this study. However, there are many publications that investigate the factors associated with the two domains separately, from which trends can be used to form hypotheses about potential relationships between the two domains.
Variables in Music Preference
To start, there is a vast body of literature discussing the various influences and predictors involved in music preference. Many articles specifically analyze personality and music preference.
For example, a meta-analysis by Schäfer & Mehlhorn (2017) synthesized the data from 28 studies and 263,196 participants, mapping it onto two dimensions of personality (the Big Five plus sensation seeking) and music preference (5 broad genre factors). The authors found that the relationship for most variables across both categories are very weak. Still, they found the following statistically significant positive correlations: agreeableness with unpretentious genres (like country or rock music), extroversion with contemporary music, openness with mellow music, openness with sophisticated music, openness with intense music, and sensation seeking with intense music.
An empirical study by Flannery & Woolhouse (2021) similarly compared the Big Five personality traits with musical preference, but using acoustic factors rather than genres. In the study, 90 participants were assessed on their personality and asked to rate their preference for various musical stimuli. Using ANOVA for statistical analysis, the researchers found that most personality variables had very low or non-existent relationships with music preference. There were some exceptions where weak yet statistically significant relationships were found: participants with high agreeableness rated music higher in general, participants with low agreeableness to preferred higher tempos, participants with low conscientiousness preferred major mode, participants with low conscientiousness preferred fast tempo, participants with low extroversion preferred piano dynamics, participants with high extroversion preferred major mode, participants with high extroversion preferred high registers, participants with low extroversion preferred fast tempo, participants with high neuroticism preferred high register, participants with low neuroticism preferred fast tempo, and participants with high openness preferred piano dynamics.
One study by Ferwerda, Tkalcic, & Schedl (2017) made use of a much larger sample, specifically tracking online music behavior. Using the myPersonality dataset, which includes the personality test results and online profiles of over 6 million participants, the researchers were able to analyze the music listening history of 2,000 users through their Last.fm accounts. After computing Spearman correlations, the researchers found various weak yet statistically significant relationships (0.1 > |r| > 0.2, p < 0.001) between a user’s genre preference in music streaming and their Big 5 personality traits. First, openness was positively correlated with the new age, classical, blues, country, world, folk, jazz, and alternative genres. Secondly, conscientiousness was negatively correlated with folk and alternative. Next, extroversion was positively correlated with the R&B and rap genres. Agreeableness was positively correlated with country and folk. Finally, neuroticism was positively correlated with alternative music.
In summary, much existing literature suggests that music preferences and personality traits have statistically significant relationships, although many of them are weak. A summary of the relationships suggested by the aforementioned articles is as displayed on Table 1.
Relationships Between Personality Traits and Preferred Music Features
| Personality Trait | Direction | Music Feature | Citation |
|---|---|---|---|
| Agreeableness | Positive | Unpretentious music | Schäfer & Mehlhorn, 2017 |
| Agreeableness | Positive | Higher music ratings overall | Flannery & Woolhouse, 2021 |
| Agreeableness | Positive | Country | Ferwerda, Tkalcic, & Schedl, 2017 |
| Agreeableness | Positive | Folk | Ferwerda, Tkalcic, & Schedl, 2017 |
| Agreeableness | Negative | Fast tempo | Flannery & Woolhouse, 2021 |
| Conscientiousness | Negative | Major mode | Flannery & Woolhouse, 2021 |
| Conscientiousness | Negative | Fast tempo | Flannery & Woolhouse, 2021 |
| Conscientiousness | Negative | Folk | Ferwerda, Tkalcic, & Schedl, 2017 |
| Conscientiousness | Negative | Alternative | Ferwerda, Tkalcic, & Schedl, 2017 |
| Extroversion | Positive | Contemporary music | Schäfer & Mehlhorn, 2017 |
| Extroversion | Positive | Major mode | Flannery & Woolhouse, 2021 |
| Extroversion | Positive | High register | Flannery & Woolhouse, 2021 |
| Extroversion | Positive | R&B | Ferwerda, Tkalcic, & Schedl, 2017 |
| Extroversion | Positive | Rap | Ferwerda, Tkalcic, & Schedl, 2017 |
| Extroversion | Negative | Piano dynamics | Flannery & Woolhouse, 2021 |
| Extroversion | Negative | Fast tempo | Flannery & Woolhouse, 2021 |
| Openness | Positive | Mellow music | Schäfer & Mehlhorn, 2017 |
| Openness | Positive | Sophisticated music | Schäfer & Mehlhorn, 2017 |
| Openness | Positive | Intense music | Schäfer & Mehlhorn, 2017 |
| Openness | Positive | Piano dynamics | Flannery & Woolhouse, 2021 |
| Openness | Positive | New age | Ferwerda, Tkalcic, & Schedl, 2017 |
| Openness | Positive | Classical | Ferwerda, Tkalcic, & Schedl, 2017 |
| Openness | Positive | Blues | Ferwerda, Tkalcic, & Schedl, 2017 |
| Openness | Positive | Country | Ferwerda, Tkalcic, & Schedl, 2017 |
| Openness | Positive | World | Ferwerda, Tkalcic, & Schedl, 2017 |
| Openness | Positive | Folk | Ferwerda, Tkalcic, & Schedl, 2017 |
| Openness | Positive | Jazz | Ferwerda, Tkalcic, & Schedl, 2017 |
| Openness | Positive | Alternative | Ferwerda, Tkalcic, & Schedl, 2017 |
| Neuroticism | Positive | High register | Flannery & Woolhouse, 2021 |
| Neuroticism | Positive | Alternative | Ferwerda, Tkalcic, & Schedl, 2017 |
| Neuroticism | Positive | Fast tempo | Flannery & Woolhouse, 2021 |
| Sensation seeking | Positive | Intense music | Schäfer & Mehlhorn, 2017 |
Variables in Linguistic Features
Other research investigates the factors correlated with language use, including online, such as a study by Holtgraves (2011). The study involved 224 students who completed personality surveys based on the Big Five, aggression, and self-monitoring. They also submitted their last 20 text messages for analysis. Holtgraves found several patterns with statistically significant and weak to moderate Pearson correlations (0.14 > |r| > 0.35, p < 0.05). First, extroversion was correlated with the use of expansions, sex words (although not necessarily swear words), and personal pronouns (especially first person singular). It correlated negatively with words related to anxiety and aggression. There were gender differences where extroversion was positively correlated with word length for females and negatively correlated with negative valence words for males. Neuroticism was also measured, which correlated positively with negative-valence words, acronyms, and emoticons. There was notably no negative correlation with positive-valence words, however. In females, neuroticism was also positively correlated with g-dropping and negatively correlated with function words and prepositions. Agreeableness was negatively correlated with swear words, negative valence words, and death-related words. In males, agreeableness also displayed a negative correlation with health-related words.
Litvinova, Seredin, & Litvinova (2015) similarly conducted research to investigate the viability of written language as a predictor of a subject’s traits. Specifically, they investigated how the prevalence of different part of speech bigrams in text written by a subject could predict their Big 5 personality traits and gender. After analyzing a collection of student essays and personality tests using Pearson correlations, they found the following positive relationships: extroversion and pers-vfin, agreeableness and pers-vfin, and agreeableness and ptcl-vfin. The study also yielded the following negative correlations: neuroticism and adj-noun, neuroticism and noun-prep, openness and noun-prep, extroversion and pers-vfin, and agreeableness and pctl-vfin. Every correlation was weak to moderate (0.2 > |r| > 0.6, p < 0.05).
A third study (Oberlander & Gill, 2004) analyzed a corpus of emails written by 105 participants. The participants had taken personality tests measuring their extroversion and neuroticism, which the researchers used to identify patterns. The researchers grouped the participants into high, mid, and low categories on each trait, then compared the frequencies of parts of speech in their emails. Using log-likelihood statistics across the groups, the researchers found statistically significant and moderately strong (4 > |G2| > 11, p < 0.05) differences in parts of speech. First, high extroverts used more conjunctions while low extroverts used more past participles. High extroversion was also associated with conj-vbn and conj-adv bigrams while low extroversion was associated with conj-vbn-prn trigrams. In the neuroticism dimension, high neurotics used more conjunctions and pronouns while low neurotics used more nouns and adjectives. High neuroticism was also associated with the following n-grams: adj-prn-vbn, adj-prn, vbn-prn-o, vbn-adj-conj. Low neuroticism was instead associated with prn-adj, prn-adb, adb-prn, and conj-adv.
In summary, the literature suggests that there are many ways in which a person’s writing, whether in emails, texts, or essays can be used as a predictor for their personality traits. A summary of the relationships identified by the literature on Table 2.
Relationships Between Personality Traits and Linguistic Features
| Personality Trait | Direction | Linguistic Feature | Citation |
|---|---|---|---|
| Agreeableness | Positive | pers-vfin bigrams | Litvinova, Seredin, & Litvinova, 2015 |
| Agreeableness | Positive | ptcl-vfin bigrams | Litvinova, Seredin, & Litvinova, 2015 |
| Agreeableness | Negative | Swear words | Holtgraves, 2011 |
| Agreeableness | Negative | Negative-valence words | Holtgraves, 2011 |
| Agreeableness | Negative | Death-related words | Holtgraves, 2011 |
| Agreeableness | Negative | Health-related words in males | Holtgraves, 2011 |
| Extroversion | Positive | Expansions | Holtgraves, 2011 |
| Extroversion | Positive | Sex words | Holtgraves, 2011 |
| Extroversion | Positive | Personal pronouns (esp. 1st person singular) | Holtgraves, 2011 |
| Extroversion | Positive | Longer words in females | Holtgraves, 2011 |
| Extroversion | Positive | Conjunctions | Oberlander & Gill, 2004 |
| Extroversion | Positive | conj-vbn bigrams | Oberlander & Gill, 2004 |
| Extroversion | Positive | conj-adv bigrams | Oberlander & Gill, 2004 |
| Extroversion | Negative | Anxiety-related words | Holtgraves, 2011 |
| Extroversion | Negative | Aggression-related words | Holtgraves, 2011 |
| Extroversion | Negative | Negative-valence words in males | Holtgraves, 2011 |
| Extroversion | Negative | pers-vfin bigrams | Litvinova, Seredin, & Litvinova, 2015 |
| Extroversion | Negative | Past participles | Oberlander & Gill, 2004 |
| Extroversion | Negative | conj-vbn-prn trigrams | Oberlander & Gill, 2004 |
| Neuroticism | Positive | Negative-valence words | Holtgraves, 2011 |
| Neuroticism | Positive | Acronyms | Holtgraves, 2011 |
| Neuroticism | Positive | Emoticons | Holtgraves, 2011 |
| Neuroticism | Positive | g-dropping in females | Holtgraves, 2011 |
| Neuroticism | Positive | Conjunctions | Oberlander & Gill, 2004 |
| Neuroticism | Positive | Pronouns | Oberlander & Gill, 2004 |
| Neuroticism | Positive | adj-prn-vbn trigram | Litvinova, Seredin, & Litvinova, 2015 |
| Neuroticism | Positive | adj-prn bigram | Litvinova, Seredin, & Litvinova, 2015 |
| Neuroticism | Positive | vbn-prn-o trigram | Litvinova, Seredin, & Litvinova, 2015 |
| Neuroticism | Positive | vbn-adj-conj trigram | Litvinova, Seredin, & Litvinova, 2015 |
| Neuroticism | Negative | Function words in females | Holtgraves, 2011 |
| Neuroticism | Negative | Prepositions in females | Holtgraves, 2011 |
| Neuroticism | Negative | adj-noun bigrams | Litvinova, Seredin, & Litvinova, 2015 |
| Neuroticism | Negative | noun-prep bigrams | Litvinova, Seredin, & Litvinova, 2015 |
| Neuroticism | Negative | Nouns | Oberlander & Gill, 2004 |
| Neuroticism | Negative | Adjectives | Oberlander & Gill, 2004 |
| Neuroticism | Negative | prn-adj bigram | Litvinova, Seredin, & Litvinova, 2015 |
| Neuroticism | Negative | prn-adb bigram | Litvinova, Seredin, & Litvinova, 2015 |
| Neuroticism | Negative | adb-prn bigram | Litvinova, Seredin, & Litvinova, 2015 |
| Neuroticism | Negative | conj-adv bigram | Litvinova, Seredin, & Litvinova, 2015 |
| Openness | Negative | noun-prep bigrams | Litvinova, Seredin, & Litvinova, 2015 |
Hypothetical Relationships
While there is a gap in the existing literature for research specifically examining the relationship between online music streaming and messaging activity, inferences can be drawn from the existing data to suggest hypothetical relationships between the two domains.
For example, Schäfer & Mehlhorn (2017) found high agreeableness to be a predictor for enjoying unpretentious music genres, while Litvinova, Seredin, & Litvinova (2015) found the high usage of pers-vfin bigrams to be a predictor for agreeableness. This may suggest that pers-vfin bigram usage could be a predictor for enjoying unpretentious music genres.
More hypotheses can be drawn using this logic, although there would be too many to reasonably describe or display here.
It is important to note that emphasize, however, that these are only inferences. First, correlations are not necessarily transitive. Secondly, all of the studies were conducted under different circumstances with differing methodologies, which can introduce noise and reduce the validity of the inferred relationships. For example, vastly different tests could have been used to measure the Big 5 personality traits. As another example, the studies analyzing written text and personality traits each used different mediums (email, texts, essays). Because of this, it is unclear whether all of their conclusions, if any, would apply to the online messaging environment relevant to this study. Additionally, many of the relationships found throughout the studies are weak. If the predicted relationships between music and messaging variables exist at all, they may likewise be very weak. Nonetheless, these patterns may be useful to form hypotheses or to provide a confounding variable that might explain future empirical findings.
Methodology
Selecting a Platform
To identify patterns between music preference and online activity, an online platform must be used that holds easily-accessible information relating to both categories. The researcher thus identified Discord, an online platform designed for communities and social groups to interact, primarily through text, which can be analyzed to obtain data about a user’s online behavior.
Discord also offers integration features that allow users to connect to other services and link profiles from external platforms. One of the supported externals platforms is Spotify, a digital service for streaming music. Public Spotify profiles display playlists that a user has created or shared, which can be analyzed to learn about a user’s music preferences.
Therefore, the researcher appropriately chose Discord as the environment to study correlations between online music and social behavior, because it provides publicly accessible information about both users’ listening habits and their online messaging interactions.
Server Sampling
It is not practical to directly sample users from Discord because of the way the platform is designed; users are only discoverable through servers, which are individual communities centered around specific topics or interests. Each server has its own member list with channels that the users can send messages in. Therefore, sampling must begin at the server level. Then, individual users must be selected from within each server.
As an ethical consideration, only publicly available servers were included. This ensures that any data obtained in the study is publicly visible to any Discord user without special permission or authorization. To find the aforementioned public servers, Top.gg was used, which is a website that provides information on public Discord servers, along with links to access them.
The researcher used a custom Python script that queries Top.gg’s API to retrieve data about the 1,000 servers with the highest user counts. From this pool of servers, a random sample of 50 servers was selected using a pseudo-random number generator. The code outputs the metadata associated with the selected server sample, including information such as the server name, member count, tags, and its invite code. The script used for this process is available on GitHub (Hidalgo Di Blasio, 2026), along with any other custom scripts mentioned.
Afterwards, the researcher manually joined the servers, with many of them requiring extra onboarding steps, such as answering questions or agreeing to rules. However, 24 servers were excluded from the sample because either: they had expired invite codes, and were thus not joinable; their primary language was not English, which would invalidate text analysis results; or they had special requirements for membership, such as an external account or a paid subscription. In total, only 26 servers were included in the sample.
User Sampling
Once this process was complete, the researcher ran another custom Python script to scrape data from Discord and create a random sample of users from each of the previously selected servers.
Due to API restraints, it is not possible to directly sample users from the list of server members. Instead, an approach was taken to instead sample users from a pool of recent messages.
For context, servers are made up of channels, which can be used to send messages and interact in. Thus, in each server, the script accessed all text channels visible to the researcher’s account; this ensures that data was only collected from publicly available sources. The script also excluded any channels where the researcher’s account was not permitted to send messages, as this would imply that normal users cannot do so either; such channels with limited permissions are commonly used for purposes like announcements, which would not be beneficial to include in the data.
Within each text channel, the script recorded the most recent 2,000 messages. Messages sent by bots were excluded. Finally, a list of users who sent any of the recorded messages was compiled. This is the list from which users were randomly sampled.
Once a list of messages from each server was compiled, the script divided the associated users into two strata based on whether they had a linked Spotify account or not. This stratification was necessary for adequate representation of both groups and the possibility to draw statistical conclusions.
From each stratum, 50 users were selected using a pseudo-random number generator. In the end, the sample was composed of 26 servers, each with 2 strata, each with 50 users, for a total sample size of 2,600. However, only 2,426 users were found. The discrepancy resulted from some servers containing fewer than 50 eligible users within one or both strata, typically due to inactive accounts or missing Spotify connections.
Music Data Analysis
A third Python script was used to analyze the Spotify profiles of every user in the stratum with linked accounts. The script used the official Spotify API to find every track on a user’s profile. Tracks were counted multiple times if they appeared multiple times across or within playlists.
Table 3 displays the metrics retrieved from the Spotify API for each of these tracks, as described by the Spotify Web API Reference (Spotify, n.d.).
Spotify API Variables
| Variable | Description |
|---|---|
| duration_ms | The length of the track in milliseconds. |
| explicit | Whether the track has explicit lyrics (true = explicit; false = not explicit or unknown). |
| popularity | A value between 0 and 100 indicating track popularity, calculated algorithmically based primarily on total play count and recency of plays. Songs with high current play frequency score higher than those popular in the past. Duplicate releases of the same track are rated independently, and artist and album popularity are derived from track popularity. The value may lag actual popularity by a few days and is not updated in real time. |
ReccoBeats, a third-party API, was also used to retrieve more audio-specific data about each track. The metrics it provided as displayed on Table 4, as described by its documentation (ReccoBeats, n.d.).
ReccoBeats API Variables
| Variable | Description |
|---|---|
| acousticness | A confidence measure from 0.0 to 1.0 indicating how acoustic a track sounds. Higher values represent greater confidence that the music consists of natural, organic sounds rather than synthetic or electronic elements. |
| danceability | A score from 0.0 to 1.0 indicating how suitable a track is for dancing, based on factors such as tempo, rhythm, beat consistency, and energy. Higher values indicate greater danceability. |
| energy | A measure from 0.0 to 1.0 of the intensity and liveliness of a track. Higher values represent more energetic, intense music, influenced by factors such as tempo and loudness. |
| instrumentalness | Predicts the likelihood that a track contains no vocals. Values closer to 1.0 indicate a higher probability of instrumental content. Values above 0.5 typically represent instrumental tracks, with confidence increasing as the value approaches 1.0. |
| key | The musical key of the track, represented as an integer using standard pitch class notation (e.g., 0 = C, 1 = C♯/D♭, 2 = D). A value of −1 indicates that no key was detected. |
| liveness | A measure of the likelihood that the track was performed live, based on the detection of an audience. Higher values indicate greater probability of a live recording, with values above 0.8 providing strong evidence of liveness. |
| loudness | The overall loudness of a track in decibels (dB), averaged across the entire track. Typical values range from −60 to 0 dB and are useful for comparing relative loudness between tracks. |
| mode | Indicates whether the track is in a major or minor mode, where 1 represents major and 0 represents minor. |
| speechiness | A measure of the presence of spoken words in a track. Values above 0.66 suggest primarily spoken content, values between 0.33 and 0.66 indicate a mix of speech and music (e.g., rap), and values below 0.33 indicate predominantly musical content. |
| tempo | The estimated overall tempo of a track in beats per minute (BPM), typically ranging from 0 to 250. |
| valence | A measure from 0.0 to 1.0 of the emotional tone of a track. Higher values indicate a more positive, happy, or uplifting mood, while lower values indicate a more negative or somber emotional tone. |
Once this data was retrieved for each track in a playlist, the Python script calculated and stored the mean, standard deviation, min, max, median, inter-quartile range, and skewness for each metric.
The length of each playlist on a user’s profile was also analyzed for the mean, standard deviation, min, max, median, inter-quartile range, and skewness.
In addition, normalized Shannon entropy scores for artists, albums, and tracks were calculated to measure the diversity of music on a user’s profile. These metrics were computed as the Shannon entropy of each distribution divided by the maximum possible entropy given the number of unique instances. This division standardizes the score to be between 0 and 1, with 0 indicating that only a single artist/album/track was included throughout the user’s profile while 1 indicates that each artist/album/track was unique. Since Spotify sometimes lists more than one artist per track, only the first artist was included when calculating the artist_entropy metric.
Message Data Analysis
After analyzing and fetching music preference data from the Spotify profiles, another script was used to analyze the Discord messages from each user and convert them to numeric data.
Several libraries, algorithms, and machine learning models were used to analyze user messages. The first among these was VADER, a rule-based model for sentiment analysis model developed by Hutto & Gilbert (2014). It was specifically fine-tuned for social media analysis, which makes it appropriate for this use case. To detect profanity, a linear SVM model called Alt-profanity-check (Mistriotis et al., n.d.) was used. Textstat (Ward et al., n.d.), a text complexity analysis library, was also used. Finally, TextBlob (Keen et al., n.d.), a text processing library was used for both sentiment analysis and to identify parts of speech in message data, which was received for several metrics.
Using these resources, along with other standard Python libraries and operations, the metrics described in Table 5 were calculated for messages.
Message Variables
| Variable | Description |
|---|---|
| alpha_ratio | The ratio of alphabetic characters to total characters in a message. Alphabetic characters are defined using Python’s str.isalpha() method, which includes letters from any language. Values range from 0 (no alphabetic characters) to 1 (only alphabetic characters). |
| ascii_ratio | The ratio of ASCII characters to total characters in a message, ranging from 0 (no ASCII characters) to 1 (only ASCII characters). |
| profanity_probability | The probability (0 to 1) that the Alt-profanity-check model detected profanity in a message, where higher values indicate greater likelihood of profanity. |
| textblob_polarity | A lexicon-based measure of sentiment polarity computed by TextBlob, ranging from −1 (very negative sentiment) to 1 (very positive sentiment). |
| textblob_sentence_count | The number of sentences detected in a message by TextBlob. |
| textblob_subjectivity | A lexicon-based measure of subjectivity computed by TextBlob, ranging from 0 (very objective) to 1 (very subjective). |
| textblob_word_count | The number of words detected in a message by TextBlob. |
| textstat_automated_readability_index | The estimated U.S. grade level required to understand the message, based on the Automated Readability Index (Smith & Senter, 1967) as calculated by Textstat. |
| textstat_coleman_liau_index | The estimated U.S. grade level required to understand the message, based on the Coleman–Liau Index (Coleman & Liau, 1975) as calculated by Textstat. |
| textstat_dale_chall_readability_score | A readability score from 0 to 9.9 based on the Dale–Chall Readability Score (Chall & Dale, 1995) as calculated by Textstat. Higher values indicate lower readability. |
| textstat_difficult_word_ratio | The estimated proportion of difficult words in the message, based on the Dale–Chall Readability Score (Chall & Dale, 1995) as calculated by Textstat. |
| textstat_flesch_kincaid_grade | The estimated U.S. grade level required to understand the message, based on the Flesch–Kincaid Grade Level (Kincaid et al., 1975) as calculated by Textstat. |
| textstat_flesch_reading_ease | A score from 0 to 100 indicating how easy the message is to read, based on the Flesch Reading Ease formula (Flesch, 1948) as calculated by Textstat. Higher values indicate easier readability. |
| textstat_gunning_fog | The estimated U.S. grade level required to understand the message, based on the Gunning Fog Index (Gunning, 1952) as calculated by Textstat. |
| textstat_linsear_write_formula | The estimated U.S. grade level required to understand the message, based on the Linsear Write Formula (O'Hayre, 1966) as calculated by Textstat. |
| textstat_smog_index | The estimated U.S. grade level required to understand the message, based on the SMOG Index (McLaughlin, 1969) as calculated by Textstat. |
| uppercase_ratio | The ratio of uppercase alphabetic characters to total alphabetic characters in a message. Alphabetic characters are defined using Python’s str.isalpha() method. Values range from 0 (no uppercase letters) to 1 (all alphabetic characters uppercase). |
In addition to the variables described above, the unigram, bigram, and trigram ratios of parts of speech were calculated using TextBlob’s parts of speech tagging algorithm. In other words, for each message, a metric was created for the ratios of each part of speech unigram, bigram, and trigram relative to all sequences of the same length.
Similarly to the music-related metrics, the mean, standard deviation, min, max, median, inter-quartile range, and skewness were calculated for every message-related metric per user.
Additionally, the total message count was recorded as the final metric for each user.
Calculating Correlations
With these variables, profiles of each user’s music and messaging habits were created. Now having this data, the Pearson correlations (Pearson, 1895) of every variable between the two categories were calculated using another custom script. Significance was assessed using a threshold of p < 0.05 and |r| > 0.2.
Some metrics may not have been calculated for some users; for example, users without any songs on their Spotify profile would not have any recorded song-related metrics like instrumentalness. To account for this, the correlations for any metric with less than 250 associated users were not calculated, as it would be likely to yield unmeaningful results from such calculations.
Results
Heatmap of Pearson Correlations Between Message and Music Variables
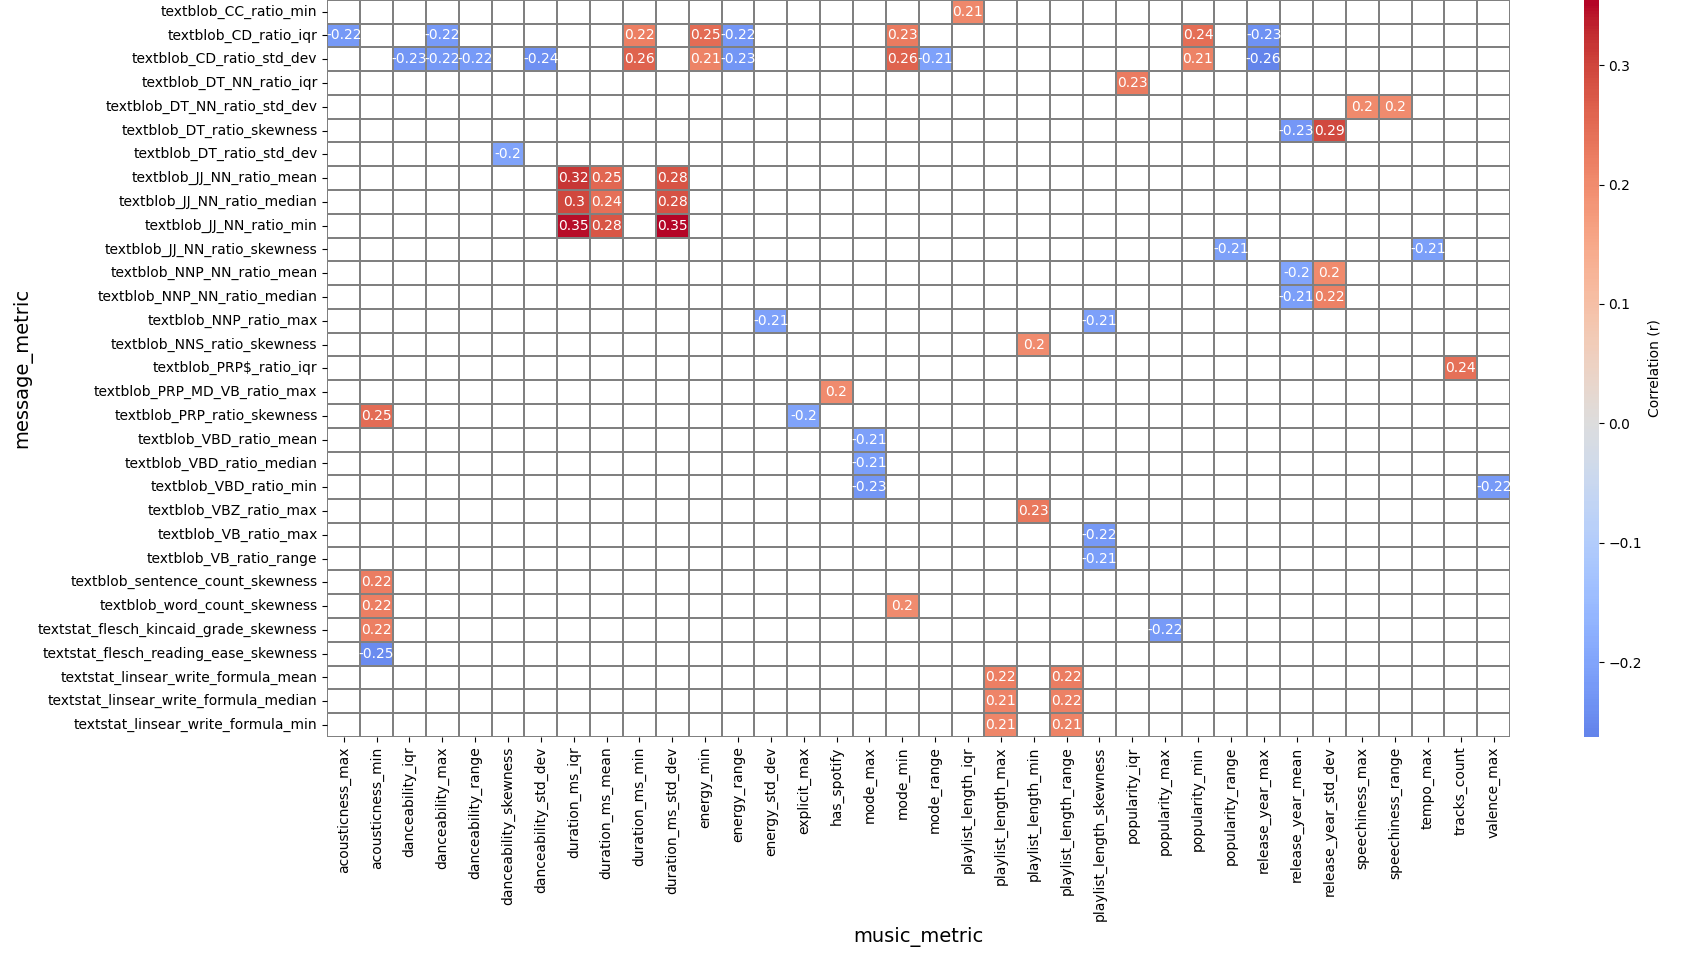
After filtering the resulting correlation data for relationships with p < 0.05 and |r| > 0.2, several weak, yet statistically significant correlations were found.
Figure 1, the provided heatmap, summarizes the relationships found using Pearson correlation values. As can be seen on the heatmap, all of the strongest relationships relate to either parts of speech n-gram ratios or text readability.
The displayed results are the only relations that are considered significant for the purposes of this study. A lack of display for any relationship signifies that the study failed to find significant evidence for it.
The full correlation data between the music and messaging metrics is available on the aforementioned GitHub repository (Hidalgo Di Blasio, 2026). The raw variables for each user are also available, with identifiable information removed.
Discussion
Based on the results of the correlation analyses, it appears that most variables in Discord messaging activity and Spotify playlist data are not strong predictors for each other. However, the data supports some variables as statistically significant, albeit weak predictors of variables in the other category.
Lack of Hypothesized Relationships
The study failed to find relationships between variables that one might expect to be more closely related. First, no strong relationship was found between the use of profanity in Discord messages and the consumption of explicit music. Secondly, no strong relationship was found between messaging length/frequency and speechiness in music. Finally, no strong relationship was found between energy or valence metrics across messages and music.
Additionally, the majority of the hypothesized personality-based relationships that were transitively derived from the literature were not found. These relationships may be too weak to detect in this sample or they may simply not transfer into the context of online messaging and music streaming at all.
Although the data failed to demonstrate many relationships, only Pearson tests were used. While this suggests a lack of strong linear relationships, perhaps other methods could identify different forms of dependency between these variables, which future research could explore.
Relationships Suggested by the Data
Still, many statistically significant relationships with higher correlation coefficients were observed between other variables. However, due to the non-experimental nature of this study, causation cannot be inferred, so the reasons for these relationships can only be speculated; further research must be conducted to assess these hypotheses and potentially develop explanations.
Most of these relationships were related to parts of speech n-gram ratios or text readability/complexity. For one, the data shows that users with higher right-skewness in the complexity of their messages (as measured by the Flesch Reading Ease, Kincaid Grade Level, word count, and sentence count), also tended to have a higher minimum acousticness, meaning they tended not to listen to any music with relatively low acousticness. One possible explanation for this may be that some highly acoustic genres like classical are often associated with audiences who are more frequently exposed to formal and literary language norms. However, highly acoustic tracks could be indicators of other non-classical genres, like country or folk, so the association is not fully clear.
Personality could also be a factor in the aforementioned relationship: because correlations between extroversion and low-acoustic genres like R&B, rap, and contemporary music were described in the literature (Ferwerda, Tkalcic, & Schedl, 2017; Schäfer & Mehlhorn, 2017), this could mean that users who listened to at least one track strongly representative of these low-acoustic genres tended to be extroverted. Since Holgraves (2011) found that extroverted subjects in his study tended to use more expansions and female extroverts tended to write longer words, extroversion could explain the link between message complexity skewness and minimum acousticness as a confounding variable.
The skewness of personal pronoun ratios also had a positive correlation with minimum acousticness. In addition, users with high personal pronoun ratio skewness tended to have a lower maximum for the explicit metric. Because the explicit metric is binary, this statistic could be interpreted as demonstrating that such users were more likely to have zero explicit songs on their profile. Furthermore, the literature suggests that a higher use of pronouns may be linked with higher neuroticism and extroversion (Holtgraves, 2011; Oberlander & Gill, 2004). Perhaps the observed tendency to avoid music with low acousticness or explicit language was a byproduct of one of these personality traits.
Users with at least one relatively large playlist (evidenced by higher maximums and ranges in playlist length) also tended to use fewer monosyllabic words and shorter sentences (as evidenced by greater mean, median, and minimum Linsear Write Formula scores in their messages). Perhaps this is because curating large playlists takes more active effort, so a user that is willing to perform such a task at least once may be more likely to also invest effort into their online messages, choosing to use more complex words in terms of syllable count.
The data also demonstrated a negative correlation between max tempo and adjective-noun bigram ratio skewness. One possible explanation for this pattern involves neuroticism: Litvinova, Seredin, & Litvinova (2015) found a negative correlation between neuroticism and adjective-noun bigrams, while Flannery & Woolhouse (2021) found a positive correlation between neuroticism and fast tempo.
Similarly, the tendency for higher neuroticism to correspond with adjective-noun bigrams could explain the negative correlation between adjective-noun bigram ratio skewness and popularity range: because Ferwerda, Tkalcic, & Schedl (2017) found that subjects with higher neuroticism were more likely to listen to alternative music, this preference could lead to more variability in the popularity of tracks on a user’s profile.
Users that listened to at least one track with a relatively high speechiness, (as evidenced by the maximum and range of the speechiness distribution for their tracks), also tended to have higher right skewness in the determiner-noun bigram. This could imply that users who listen to at least one rap or spoken word track tend to write determiner-noun bigrams in their messages with higher right-skewness relative to other users. Although there are no clear interpretations, Ferwerda, Tkalcic, & Schedl (2017) found a positive correlation between extroversion and listening to rap, which may play a role in this relationship.
The data demonstrated several further relationships between music streaming and messaging variables, as displayed in the results, but they did not have any clear hypothetical interpretations based on existing literature or plausible mechanisms. Therefore, they are not discussed further, although future research could investigate them more thoroughly.
Again, it is important to note that the true explanations of the discussed relationships are unknown. The described hypotheses are only provided as considerations for future research topics and should not be considered strict claims made by the study.
Limitations
There are many limitations to both the study’s methodology and its results, potentially affecting the generalizability and applications of the study.
For one, it is unclear how representative the sample was, and by extension, how generalizable the results are. The data was retrieved exclusively from Spotify and Discord, so the relationships found may not apply on any other music streaming or social media platforms.
It is also important to note that technical limitations in interacting with Discord did not permit true random sampling. As mentioned in the methodology, the most recent 2,000 messages from each channel were retrieved, from which a random sample of users were selected. This means that users who are inactive are underrepresented.
In addition, the sample was intended to capture English messages to limit the scope of the study. To achieve this, non-English servers were manually removed from the sample, as mentioned in the methodology. However, there could have still been many non-English messages included in the data. It is not clear whether the potential non-English data could have affected the validity of the results, nor is it clear whether the results could be applicable to non-English online messaging contexts.
The Spotify API introduced further limitations. Since streaming data is not made public, the study had to rely on the playlists that a user chooses to make public, which may not be representative of their true preferences and habits.
Furthermore, the study did not utilize musical genre as a metric due to technical restraints from the Spotify API: because the API does not provide genre data for individual tracks, the genre would have to be derived from the associated artist. First, this could have made the genre metric inaccurate as different songs from the same artist can be in very different genres. Secondly, tracks can have multiple artists, which would complicate the metric. Finally, this approach would imply roughly doubling the number of Spotify API calls to get genre information about every artist in the data, which would dramatically increase the required computational time and resources. The higher number of API calls could also lead to being rate limited or banned from Spotify’s service. Perhaps future research could utilize a more practical and efficient method to measure track genres.
Additionally, there is a limitation introduced by the audio feature variables (such as acousticness, danceability, speechiness, etc.): the exact methodology for calculating these properties is unknown. The study utilized the ReccoBeats API to acquire this data, and although it appears to mirror the audio feature properties formerly offered by the Spotify API, neither services specify how the data is calculated or acquired. Therefore, there may be inaccuracies in these metrics which could have influenced the results.
Finally, artist data was not within the scope of the study, although it may have provided interesting results. Future research could find specific patterns in online messaging behavior for strata that listen to specific artists, for example.
Applications of Findings
Although the results do not include very strong correlations, among other aforementioned limitations, there may be several applications to the findings.
Because the results suggest that some messaging variables may be statistically significant predictors of music preference, it could support the viability of messaging data as useful input for music-recommendation algorithms. Perhaps future research could attempt this and identify whether such an approach could increase user satisfaction with music recommendations.
Similarly, the results could imply that online communication patterns could be used to predict other media and consumption habits, which could be useful in marketing or social research.
However, there are also potential ethics and privacy issues with these applications of message data, which would have to be addressed.